Snow becomes a moving archive
A glacier develops where snow persists and accumulates over many years. Burial compresses older snow into firn and eventually into ice. Under its own weight, the ice deforms and flows. The Greenland Ice Sheet is a vast example; smaller glaciers occupy mountain valleys across places such as Svalbard, Iceland and the Canadian Arctic.
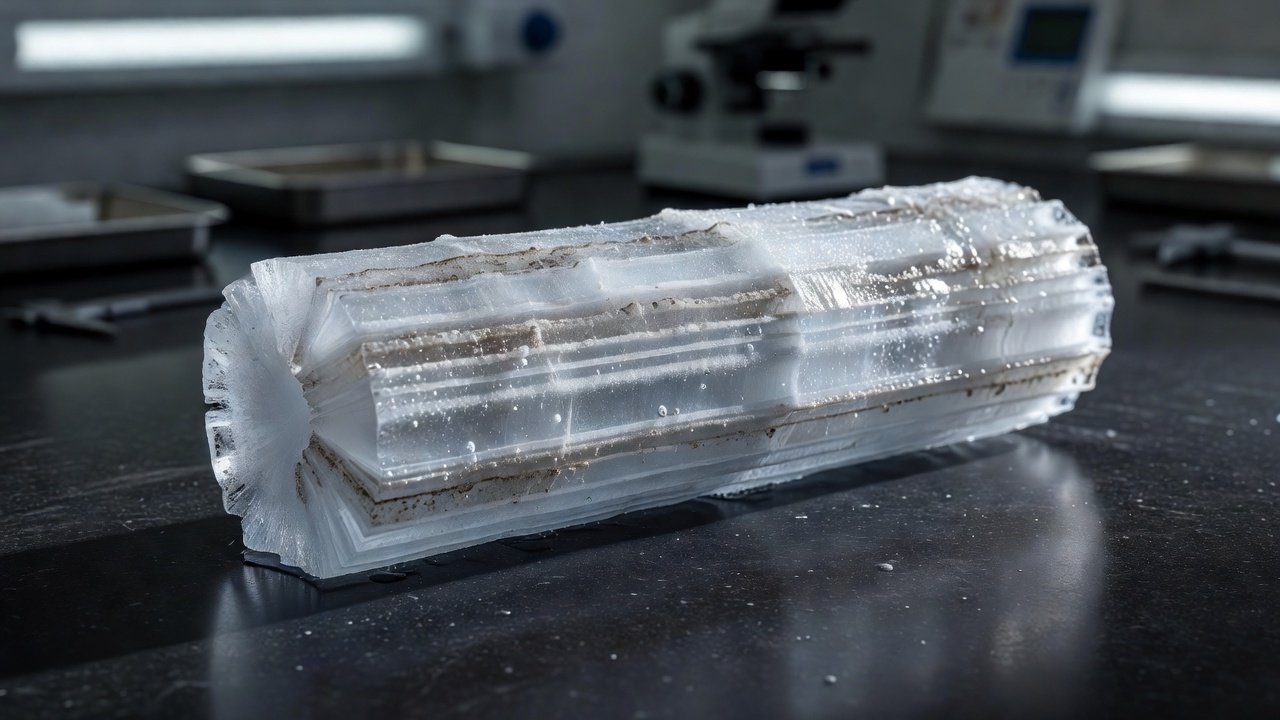
Layers can retain dust, volcanic material, chemical traces and information about the water from which the snow formed. Air bubbles become enclosed as the porous firn turns into solid ice. These features are valuable because they preserve different aspects of the past, but they are not all clocks set to exactly the same moment.
What an ice core actually measures
Researchers measure properties such as stable isotope ratios in the ice and greenhouse-gas concentrations in extracted air. Isotope ratios are influenced by temperature, moisture source and the path taken by precipitation. They are therefore interpreted using physical understanding, calibration and comparisons with other evidence, rather than read as a simple thermometer.
The air in a bubble is generally younger than the surrounding ice because gases can still move through porous snow before it seals. Dating the ice and dating the trapped gas require attention to this difference. Annual layers, identifiable volcanic horizons and models of accumulation and flow can help build a chronology, with uncertainty increasing in difficult sections.
Conceptual diagram / not to scale
Open pore spacesCompacted firn
Air still exchangedGlacier ice
Bubbles enclosed
Mass balance is a budget
To understand present change, start with gains and losses. Snowfall adds mass. Surface melting, runoff, sublimation and the discharge of ice into the ocean can remove it. For an entire ice sheet, a complete accounting must distinguish the surface budget from ice flowing across its boundary.
Field teams can install stakes and dig snow pits to measure local accumulation and ablation. Those observations are detailed but geographically limited. A stake on one valley glacier does not describe Greenland as a whole. Consistent methods and repeated visits allow local measurements to become a meaningful time series.
Observation
A repeat survey finds that an ice surface is lower than before.
Explanation
The change may reflect ice loss, snow changes, compaction or ice dynamics. Converting height into mass requires additional information.
Three ways to watch a large ice sheet
Satellite altimetry measures surface height along repeated tracks or across mapped areas. Comparing elevations can reveal thinning and thickening. Researchers must account for factors such as snow density, firn compaction and the movement of the underlying land when interpreting those changes.
Satellite gravimetry offers a different view. NASA and the German Research Centre for Geosciences use the GRACE Follow-On mission to track changes in Earth’s gravity field. Regional changes can indicate shifts in mass, but separating ice loss from other signals requires corrections and careful spatial interpretation.
A third approach compares estimated surface mass balance with ice discharge. Surface speed can be measured from satellite imagery, while ice thickness and the geometry of outlet glaciers help determine how much ice crosses a boundary. Agreement among independent approaches strengthens confidence; differences can identify missing processes or uncertain inputs.
A retreating front is not the whole budget
A glacier terminus can retreat when melting or iceberg calving exceeds the delivery of ice to its front. Yet the front position alone does not measure total mass loss. A glacier may thin far inland, or change speed, without an immediately dramatic shift in its visible edge.
Land ice contributes to sea-level rise when its loss transfers water to the ocean. Floating ice shelves have a different direct effect, but they can restrain the flow of grounded ice behind them. In Antarctica, this buttressing role helps explain why the condition of an ice shelf matters beyond the shelf itself.
Local sea-level change is not identical everywhere. Ocean circulation, land motion and changes in gravitational attraction affect the regional pattern. A global average is a useful summary, not a prediction for every coastline.
Read a glacier claim carefully
Ask whether the claim concerns one glacier, a group of glaciers or an entire ice sheet. Identify the interval between measurements and whether the reported quantity is length, elevation, mass or flow speed. Check whether an uncertainty range accompanies the estimate. A striking photograph can orient you, but a repeatable measurement establishes the change.
- World Glacier Monitoring Service — internationally compiled glacier observations.
- NSIDC ice-sheet explanations — physical processes and monitoring context.
- NASA GRACE Follow-On — satellite observations of changing mass.
- British Antarctic Survey — polar research, ice cores and Antarctic science.