Start with frozen seawater
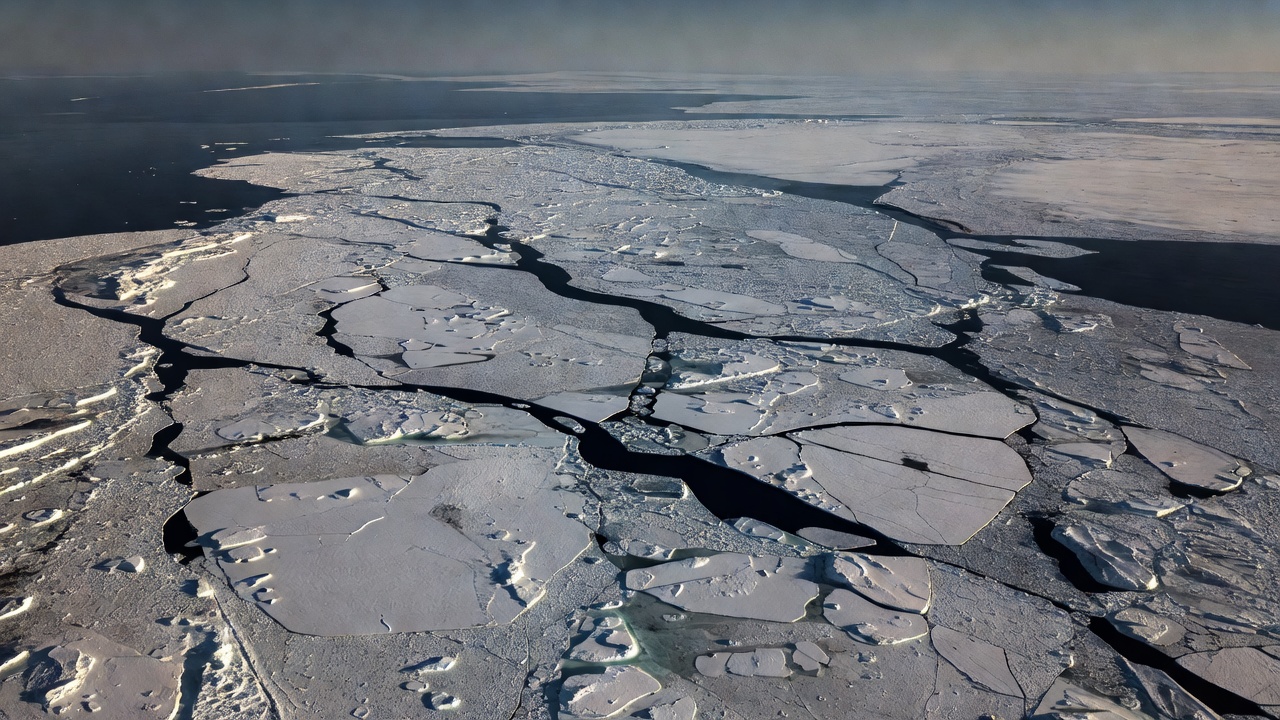
Sea ice forms when the ocean surface loses enough heat for seawater to freeze. Its freezing temperature depends on salinity and is lower than that of fresh water. New crystals collect into thin ice; wind, waves and currents can rearrange them into larger floes. Some ice melts during the following summer, while some survives into another year.
The Arctic Ocean, including the Beaufort Sea, Chukchi Sea and central basin, contains a moving cover rather than a fixed lid. Winds push floes together, opening leads elsewhere. Compression can build ridges much thicker than the surrounding level ice. A useful description therefore needs more than the position of a single boundary.
Four quantities, four questions
| Measure | What it describes | What it does not establish alone |
|---|---|---|
| Extent | Area of grid cells meeting an ice-concentration threshold, commonly 15%. | Total ice volume. |
| Concentration | Fraction of a sampled area covered by ice. | Ice thickness or strength. |
| Thickness | Vertical dimension of the ice. | Regional coverage without a spatial map. |
| Volume | Ice amount combining area and thickness. | A direct measurement everywhere; estimates can depend on models. |
Sea-ice area is also distinct from extent: it weights each grid cell by its estimated concentration. Two maps can show similar extent but different amounts of open water within the boundary. Check the product definition before comparing a chart from one provider with a chart from another.
How satellites see the ice
Passive microwave sensors measure naturally emitted radiation. Because they do not depend on sunlight, they can observe through the polar night, and many clouds are less obstructive than they are for visible imagery. Algorithms convert the measured signal into estimates of ice concentration. Coastal contamination, surface melt and sensor resolution can complicate that conversion.
Altimeters contribute another kind of evidence. Radar or laser measurements can estimate the height of the ice or snow surface relative to nearby sea level. Converting this freeboard into thickness requires assumptions about snow depth and the densities of snow, ice and seawater. ESA’s CryoSat and NASA’s ICESat-2 provide complementary observations, not identical views of every surface.
Observation
A sensor records a signal or surface height over a particular footprint.
Explanation
An algorithm translates that signal into a geophysical estimate, with stated assumptions and uncertainty.
Read the seasonal cycle before the headline
Arctic sea ice generally reaches its largest seasonal extent near the end of winter and its smallest near the end of summer. Comparing a September value with a March value mostly reveals the seasonal cycle. Comparing the same part of the year across many years is more informative about longer-term change.
A windy week can spread ice outward and increase extent without creating a comparable increase in ice volume. Warm ocean water can melt ice from below, while surface melt responds to atmospheric conditions and sunlight. These mechanisms can operate together. One unusual season is not a complete explanation of a multi-decade pattern.
Long satellite records show a substantial decline in Arctic sea-ice extent, especially at the late-summer minimum. That broad conclusion does not mean every region declines every year. The Barents Sea and the Canadian Arctic Archipelago differ in geography, circulation and local variability. Regional claims should be checked against regional evidence.
Why the change matters
Snow-covered sea ice reflects much of the incoming sunlight. Darker open water absorbs more, which can reinforce warming during sunlit months. Sea ice also changes heat exchange between ocean and atmosphere and supplies habitat used by ice-associated organisms. The strength of each effect depends on season, location and surrounding conditions.
For communities and wildlife, timing can matter as much as a yearly minimum. Freeze-up and break-up affect travel conditions, access to hunting habitat and exposure of coasts to waves. A basin-wide extent chart cannot tell a traveler whether a local route is safe. This website is not an ice-navigation or field-safety service.
A practical reading check
Before sharing a sea-ice claim, identify the hemisphere, date, variable and comparison period. Ask whether the image shows a measurement, a reconstruction or a future scenario. Look for uncertainty information and the source dataset. If a headline says “more ice,” establish whether it means extent, thickness or volume before drawing a conclusion.
- NSIDC Sea Ice Today — observations, methods and current Arctic context.
- ESA CryoSat — radar altimetry and polar ice observations.
- NASA ICESat-2 — laser measurements of Earth’s surface heights.